|
In this series of posts, Hog Sr. will tell you about some the chemicals that played important roles in the evolution of humankind (and Hog-kind too) and in the development of our world. He will start by tell you about quinine, which was crucial for the colonization of Africa and the development of modern optical spectroscopy. Quinine - Fluorescence, Medicine and Cool Drinks Quinine is a naturally occurring alkaloid that has had a marked impact in medicine, photophysics and nightlife. It was first isolated in 1820 from the bark of the Cinchona tree and found to be responsible for the anti-malarial activity of the bark extract. This compound is toxic to the Malaria parasite, Plasmodium falciparum, by interfering with its ability to metabolize haemoglobin. For this reason, quinine is on the World Health Organization's List of Essential Medicines, the most effective and safe medicines needed in a health system.  The natural source of quinine: Cinchona tree (left) and its bark (middle). Right: Quinine molecular structure It was the discovery of quinine and its medicinal properties that allowed the European colonists to colonize and settle in the region of West Africa, until then known as the “white man’s grave” due to the high Malaria-related mortality. However, the role of quinine in the world’s geopolitics was not over. In the 19th century, the British started the colonization of India, and soon began being infected with malaria. Thus, quinine came to the rescue of the colonists again. However, this alkaloid is very bitter, and the British soldiers’ taste was not as tolerant as a Hog’s. For this reason, the British started adding quinine to a sweetened carbonated drink, creating tonic water, and mixed it with their favourite alcoholic beverage, gin, creating the worldly known combo Gin and Tonic. 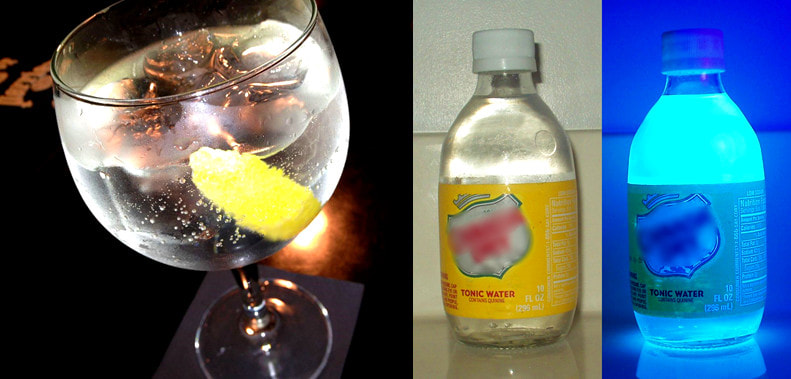 The popular Gin and Tonic cocktail (left), prepared with tonic water containing Quinine Later, during World War II, quinine hit the spotlights again. By that time, the Netherlands controlled most of the worldwide production of this anti-malaria drug and when Germany conquered this country, the Allied Forces were cut from their supply of quinine and infection spread through soldiers stationed in Africa and South Pacific. This lead to an urgent demand for new anti-malaria drugs. At Golwater Hospital, in New York, thousands of new drugs were tested. In order to determine if those drugs reached the malarial parasites in the blood and to learn how to adjust the dosages to avoid side effects, they devised a method that was already applied to quinine: fluorimetry. Quinine fluorescence was known since the 16th century when the Spanish conquistadores brought the Cinchona tree to Europe to study its medicinal properties and described the aqueous infusions as “opalescent blue”. This property was actually used for over 300 years to estimate the medicinal “strength” of bark extracts and, in the 20th century, was carefully determined through fluorescence measurements for the same purpose. 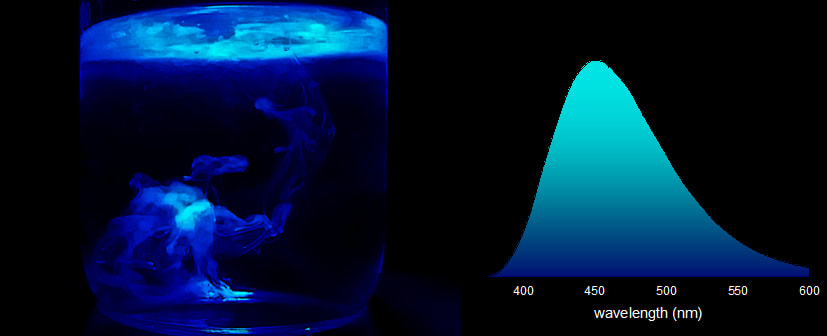 Fluorescence of Quinine: Left: a solution is dropped in pure water; Right: Emission spectrum of Quinine in water By applying fluorimetry to the plasma of infected patients, scientist at Goldwater could quantify the amount of drug needed for the therapeutic effect, determining the standard dosage used by the U.S. armed forces as a preventative for malaria. However, not all drugs fluoresced in the same wavelength as quinine and were, therefore, undetectable in the plasma. This problem ultimately led to the development of the first spectrofluorimeter by a team of scientists from the National Health Institute, capable of measuring the fluorescence of samples at several wavelengths. This instrument started being sold by the American Instrument Company in the 1950s. Ever since its creation, the spectrofluorimeter has met incredible improvements, and currently plays a crucial role in a wide range of scientific research. 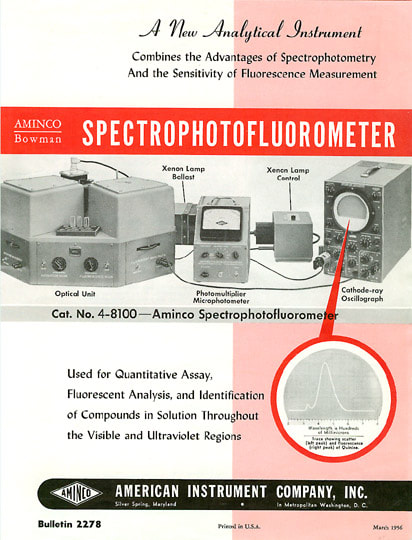 AMINCO bulletin highlighting the new spectrofluorometer (1956) From its early use by the Incas and later by the European colonists to its role in the World War II, quinine has, for better or worse, helped shape our world to what it is today, and it is, undisputedly, one of the history’s most important chemicals. Remember this next time you order a Gin and Tonic. 
0 Comments
Every day, we go through our lives surrounded by fluorescent molecules without even realizing it. Common dull objects gain a new interest under UV light and can be surprisingly pretty. In the next weeks Hog Sr. will pick his UV lamp and embark on a journey to show you how our world looks under a different light. In this post we take a look at something that is literally everywhere: plants. From the lowliest weed to the tallest tree, if your shine UV light on the green flesh of a plant, it will shine red. Take a look at these pictures. 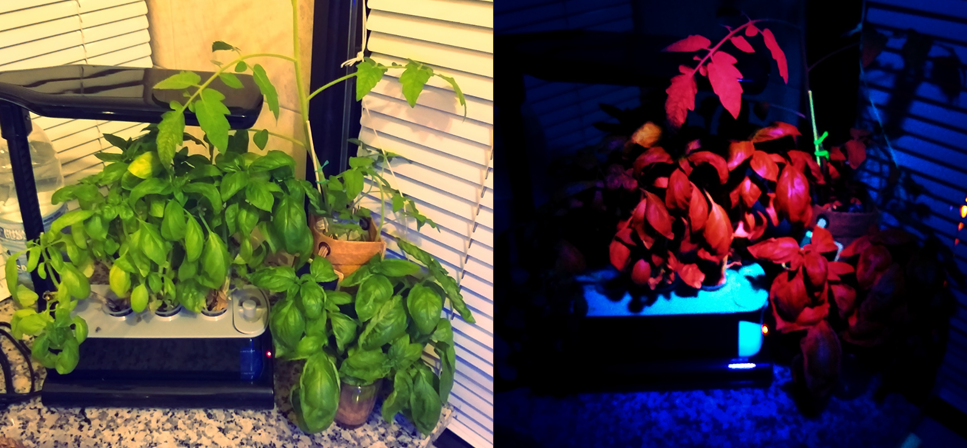 Common Basil on Aquaponics system. Green under white light (left), Red under ultraviolet light (right).  Succulent Case of Dr. Jekyll and Mr. Hyde  Red fluorescence also occurs in aquatic plants. Here inside an aquarium. This red luminescence comes from chlorophyll, the main pigment responsible for the photosynthesis. Chlorophyll is found in virtually all photosynthetic organisms, including plants, algi and even some bacteria (cyanobacteria). There are several forms of chlorophyll, depending on the organism, but they all share a common porphyrin core complexing a magnesium atom. 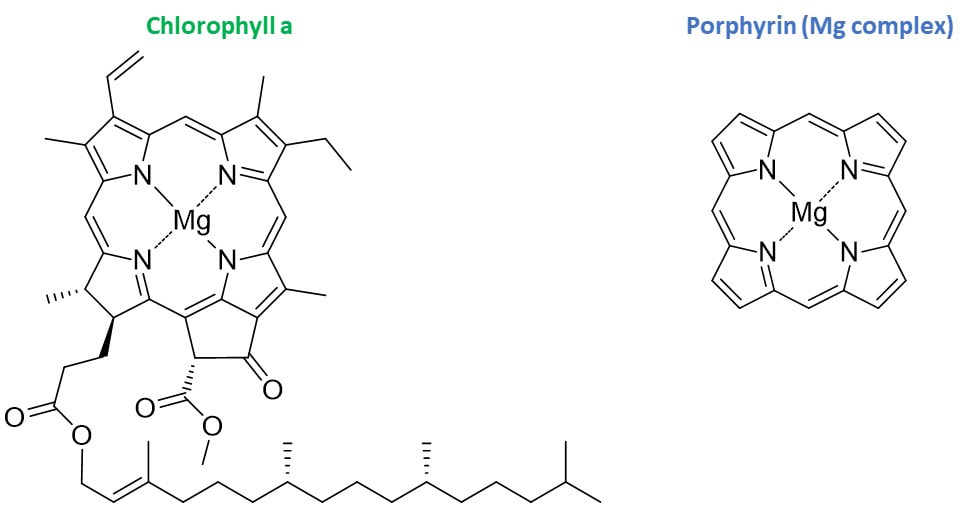 This core is what allows chlorophyll to absorb sun energy and appear green under visible light. Here are the absorption spectra of Chlorophyll a and Porphyrin magnesium complex. 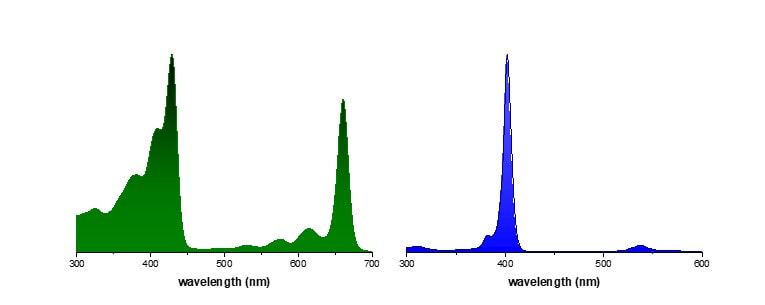
 With this information, you can easily spot fake plants. In the next image, the real plant on the left has red fluorescence, while the fake one, shines blue and green due to the artifical dyes.  The fake plants, with artificial dyes, will not shine red when exposed to UV light. Fun fact: Chlorophyll is remarkably similar in structure to hemoglobin, the oxygen-carrying pigment found in the red blood cells of mammals and other vertebrates. Maybe the Hogs will cover this on a future post.
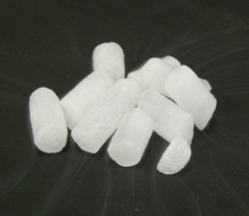 It is Summer, the temperature is rising, and the Hogs wish for a COOLing bath! But in the lab, cooling baths are slightly different. Imagine that you have a very reactive or sensitive reagent or that you want to slow down a procedure in order to selectively synthesize one specific product. If that is the case, you need to decrease the temperature of your reaction. When the Hogs need to run a reaction below room temperature, they use cooling baths. These are often made from mixture of a cryogenic component, such as liquid nitrogen, ice or dry ice (CO2) and a solvent or a salt. Salt-ice COOLing mixtures For temperatures from zero down to – 55 °C an ice/water bath with addition of salts is the easiest setup and most safety in every undergraduate teaching laboratory. The final temperature will depend on how finely crushed the ice is and how well the mixed components are. The salt lowers the freezing point of the mixture, The choice of containers is very flexible. From Tupperware containers and beakers to used styrofoam ice-cream boxes. However, baths colder than – 10 °C should be made in an insulating container, otherwise it will not maintain the temperature for a long period of time. Hog tip: Mix crushed ice with a near equal volume of cold-water, so the water will fill the empty air spaces between the ice and the reaction flask. Dry-ice COOLing baths Dry ice is the solid form of carbon dioxide, CO2. It is a dense, snow like substance with a surface temperature of - 78.5 °C that sublimates (passes directly into the vapor without melting) into carbon dioxide gas. As a penny pincher Hog, he likes dry ice, because it is a fairly inexpensive cryogenic agent. Nevertheless, he spent money in a Dewar. In order to avoid Hog Jr. spending time adjusting more often the bath temperature, the ideally bath container for a dry ice bath is a Dewar. The solvent helps transferring the temperature of the cooling component to the reaction flask. For an efficient heat transfer between dry ice and the solvent, the solvent is required to have a melting point below - 78 °C. Solvents with higher melting point can also be used and will result in a higher bath temperature. However, you must add dry ice slowly to avoid freezing the entire mixture.  Liquid Nitrogen baths When we need temperatures below - 78 °C we use liquid nitrogen baths. Liquid nitrogen N2is a cryogenic fluid with a melting point of - 196 °C. Hog paws are freezing! When handling liquid nitrogen only a Dewar should be used. As liquid nitrogen is a liquid, the use of a solvent for uniform heat transfer is not necessary. However, if you need a temperature higher than - 196 °C, there is a variety of organic solvents that could be used to make mixtures with liquid nitrogen at different temperatures.  Safety: Always use cryogenic protective gloves and safety goggles. The gloves will protect your skin, as cryogens can rapidly the burn skin and cause frostbites.
Hog tip: If you open your reaction flask while it is immersed in the cooling bath, air will quickly flow inside. If your reaction is moisture sensitive, it will not be so COOLing at all. Penny pincher Hog tip: Solvents used for cooling baths can be kept, stored and reused for another bath. References:
 When preparing samples for fluorescence measurements, keep absorbances below 0.1. High optical densities can lead to primary or secondary inner filter effects (IFE). Primary IFE occurs due to excessive absorption of the incident light, whose intensity will decrease in the center of the sample, and emission intensity will not be proportional to the absorbed light. This is especially important when determining quantum yields, since the measured fluorescence will not correspond to the total emitted light. The primary IFE can be mathematically corrected or mitigated using Front Face geometry in acquisition, but it is best avoided.  The graphic shows the intensity attenuation due to the IFE for a known fluorophore (quinine sulphate). Note that above 0.1 in optical density, the fluorescence intensity is no longer proportional to the absorbance. Secondary IFE occurs when there is a large overlap between absorption and emission spectra (small Stokes shift). In such cases, IFE results in distorted emission spectra due to intensity attenuation at shorter wavelengths. This is what happened when Hog Jr. was trying to study the effects of molecular aggregation. The compound had a small Stokes shift, and a large portion of the fluorescence spectrum (shown in purple) is attenuated when the concentration is increased.  Example of absorption and emission spectra of a compound with a small Stokes shift. The purple section of the spectrum will be affected by the IFE in concentrated solutions. The result: a diluted solution of a compound with green emission gradually displays an apparent color change due to attenuation of green and yellow emission wavelengths (<600 nm). 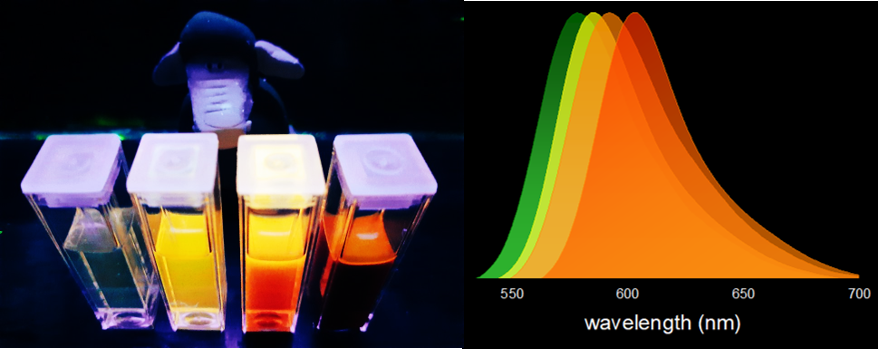 Hog Jr believed he was seeing molecular aggregation with a redshift in fluorescence...Silly Hog, it was just a classical case of inner filter effect. The students these days... For compounds with vibronic resolution, entire bands can be suppressed due to the secondary IFE. In the next example, the real absorption and fluorescence spectra are shown in red and blue, respectively. However, in the fluorescence spectrum of a concentrated solution (yellow), the first vibronic band is almost entirely vanished, and the second is strongly attenuated.  Absorption and emission spectra of a polycyclic aromatic hydrocarbon, with strong vibronic resolution. The fluorescence spectrum of a concentrated sample (yellow) shows decreased intensity in the first and second vibronic bands, due to the secondary IFE. Therefore, I repeat: “Beware of the Inner Filter Effect. When preparing samples for fluorescence measurements, keep absorbances below 0.1.”
In this video, a few drops of a dark solution are added to a weakly green emitting liquid. Then, the luminescence increases and starts changing its color from green to orange. Is this magic? Could it be Hog voodoo? No, it’s simply…chemistry. In the quartz cuvette there is an aqueous solution of a luminescent compound, which has green fluorescence in water. 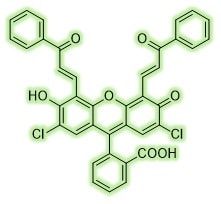 This molecule belongs to the family of xanthene dyes, which include fluoresceins, rhodamines and eosins. Xanthene dyes are widely used many different applications, from lasers to CSI-style bloodstain detection. Some of them are even on the World Health Organization List of Essential Medicines, due to their important role as a diagnostic tool in ophthalmology or oncology. 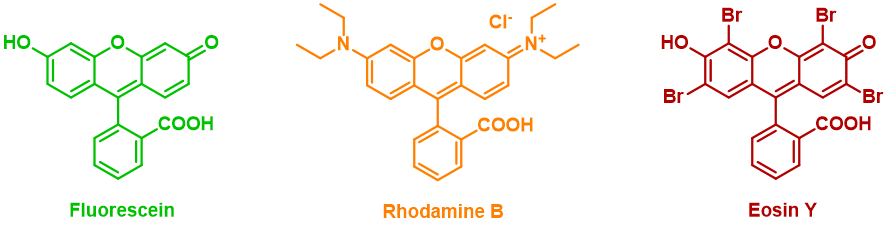 Then, an aqueous solution containing a protein is added to the cuvette. This protein is Bovine Serum Albumin (BSA), which belongs to the Albumin protein family, water-soluble globular proteins that are essential to regulate blood circulation in animals. They are the main component of egg white, from which they get their name (from Latin: albumen, meaning ‘whiteness’).  Bovine Serum Albumin As globular proteins, albumins are spheroid shaped and have the ability to bind to smaller molecules in their interior. In this case, our luminescent compound has great affinity to BSA, and readily goes to its ‘pocket’. The hydrophobic pocket of the protein shifts the fluorescence color from green to orange, due to a decrease in polarity.  Cabbage is in the Hog Menu, but also in the Hogs’ reagents list. Where does this amazing color-change come from? From molecules, of course, and their protonation and deprotonation states. This is due to pH and how it affects the way electrons flow through the atoms. Believe in the Hogs, a lot of things is about electrons moving! By adding or taking protons from a molecule, we can change the number of conjugated π electrons, and, that way, change their absorption spectrum and the color we see. Remember the particle in a box model? You can make your own pH indicator by boiling red cabbage and filtrate the purple juice. This natural pH indicator changes colors depending on the acidity of the solution. When the indicator comes in contact with a solution, the indicator's color corresponds to that solution's approximate pH. The pigment in red cabbage that causes the color change is an anthocyanin. Anthocyanins are water-soluble pigments and also antioxidants that have hit the headlines due to a range of health benefits. 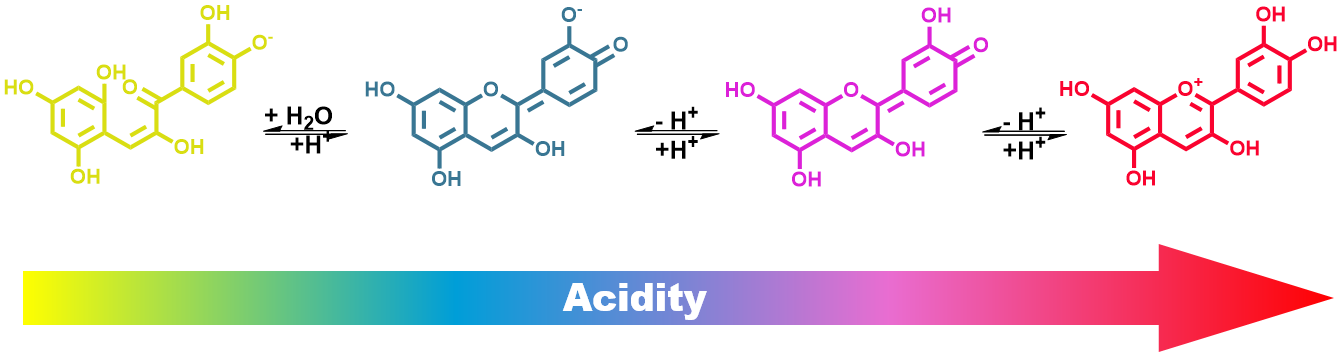 The Hogs like to be healthy, but they are also resourceful. When your pH paper is finished, just soak a filter paper in red cabbage juice, dry it and you have your own vegan pH paper strips.  Always cut your TLC plate bottom corners at an angle. This ensures an uniform and straight elution. Uncut corners might have defects that can result in crooked eluent front and superimposed spots.  |
ArchivesCategories
|

 RSS Feed
